
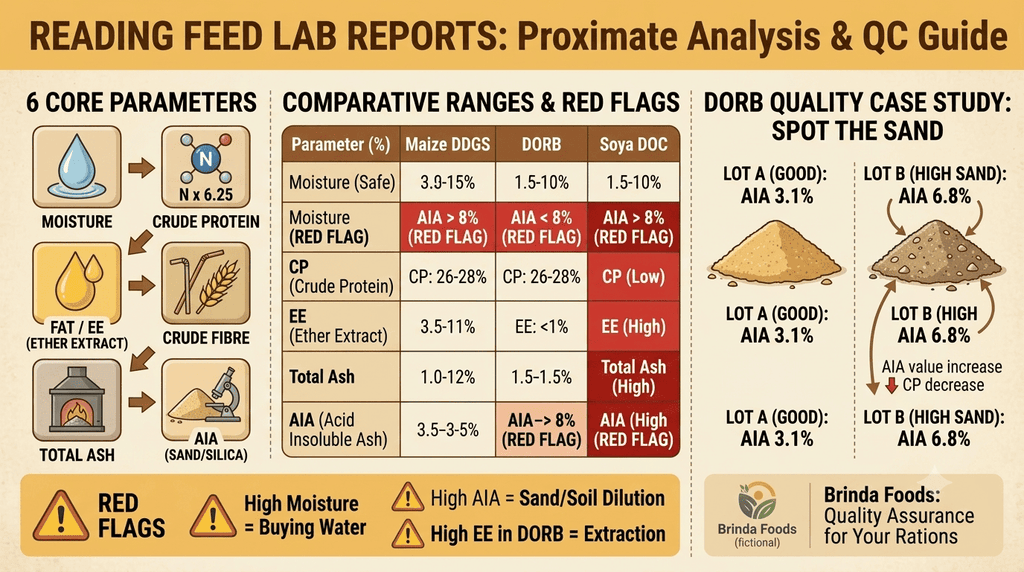
Quick answer: Proximate analysis breaks a feed sample into six parts. These are moisture, crude protein (nitrogen × 6.25), ether extract or fat, crude fibre, ash, and nitrogen free extract, which the lab works out by subtraction. If you only learn one extra number, make it acid insoluble ash (AIA). It’s mostly sand and silica, and it tells you how much of your purchase is doing nothing for the ration.
Most lab reports get about ten seconds of attention. Someone checks protein, checks moisture, signs the gate pass, and the truck rolls in.
We get it. The QC desk is busy. But the remaining lines on that sheet are quietly answering questions you’d want answered anyway. Was the oil properly extracted? Did a few bags pick up sand somewhere between the mill and your godown? Is this DDGS really from the same plant as last month’s?
We read these reports every single day from the supplier’s end, so we thought we’d walk you through one the way we do it. Further down, you’ll find two sample reports with our notes on them (one Maize DDGS lot and two DORB lots), plus a red flag table that’s worth printing.
For a wider look at the ingredients themselves, start with our cattle feed raw materials guide. That piece lists what millers test for. This one is about actually reading the results.
What is proximate analysis?
It’s the basic, everyday test that sorts a feed sample into six rough nutrient groups. You’ll sometimes hear it called the Weende system, a name that comes from the German research station where it was worked out back in the 1860s.
Why “proximate”? Because every number on it is close to the truth, but not exactly the truth. Crude protein isn’t only protein. Crude fibre misses a fair chunk of the fibre. The test has survived 160 years anyway, since it’s cheap, quick and every lab in the country can run it the same way.
In India, most labs follow BIS IS 7874 or the equivalent AOAC methods.
| Report line | What it really measures | How the lab gets it |
| Moisture | Water lost on drying | Oven at about 105 °C |
| Crude protein (CP) | All the nitrogen, converted to protein | Kjeldahl or Dumas, nitrogen × 6.25 |
| Ether extract (EE) | Oil and fat, with some waxes and pigments | Solvent extraction (Soxhlet) |
| Crude fibre (CF) | Fibre that survives acid and alkali | Boiled in dilute acid, then dilute alkali |
| Total ash | Every mineral, sand and soil included | Burnt at 550 to 600 °C |
| Acid insoluble ash (AIA) | Silica and sand within the ash | Ash boiled in dilute hydrochloric acid |
| Nitrogen free extract (NFE) | Starch, sugars and some leftover fibre | Not measured; 100 minus the rest |
Before you look at a single figure, find out whether the report is on an as is basis or a dry matter basis. Everything else depends on that.
- Moisture comes first, for a reason!
Moisture is just water. Take it away and what’s left is dry matter, so DM is simply 100 minus moisture.
Sounds basic. Yet it’s behind more supplier arguments than almost anything else on the sheet, because one bag can honestly carry two protein figures. An as is report counts the water. A dry matter report removes it on paper, and suddenly every nutrient looks better.
Take a Maize DDGS lot at 10.4% moisture with 28.6% CP as is. On dry matter, that’s 28.6 ÷ 89.6 × 100, or 31.9%. Nothing in the bag changed. Only the maths did.
So if you’re comparing two quotes, get both reports onto the same basis before you decide anything. We’ve gone into this in more depth in our COA guide.
Moisture also hints at how long the stock will keep. Anything coming in above roughly 12% (or 11% for DORB) is more likely to mould, and in the monsoon that happens quickly. Our storage guide has practical tips for the godown.
- Crude protein, and that famous 6.25
Here’s something many people don’t realise. The lab never measures protein. It measures nitrogen and converts it.
Most feed proteins are about 16% nitrogen. Divide 100 by 16 and you get 6.25, which is the factor every report uses.
CP (%) = N (%) × 6.25
So if a Soya DOC sample shows 7.36% nitrogen, the report will say 46.0% crude protein.
The trouble is that the test can’t tell where the nitrogen came from. Urea and other non protein nitrogen get counted as though they were real protein, even though they bring no amino acids with them. When a protein meal suddenly reads two or three points above its normal range, be curious rather than pleased.
A couple of habits that help:
- Look at the method column. Kjeldahl and NIR can give slightly different results on the same sample.
- If a lot looks unusually good, ask for a urea or NPN test before paying a premium for that protein.
3. Ether extract and why it matters in a DOC
Ether extract is whatever a fat solvent can pull out of the sample. Mostly oil, plus a little wax and pigment. Some labs just write “crude fat”.
With Maize DDGS, you want that number healthy and steady, because much of the energy sits in the fat.
With a de-oiled cake, the same line answers a very different question: did the plant actually get the oil out? Solvent extracted Soya DOC and Mustard DOC normally land somewhere between 0.5 and 1.5% EE. Expeller cake, which is pressed rather than solvent extracted, carries a lot more.
So a “solvent extracted” DOC that reads 3% EE should make you pause. There’s a fair chance you’ve received expeller cake, which formulates differently. And even if you haven’t, that extra oil goes rancid faster, particularly in the summer months.
DORB behaves the same way. Rice bran begins life with about 18 to 22% oil, and well extracted DORB should come down to roughly 1 to 1.5%. Once you see anything over 2%, either the extraction wasn’t complete or someone mixed in raw bran.
4. Total ash vs acid insoluble ash
Burn a sample at 550 to 600 °C and what’s left behind is total ash. Some of it is useful, like calcium, phosphorus and potassium. Some of it might be sand, dust or plain soil.
AIA tells those two apart. The lab boils the ash in dilute hydrochloric acid, the nutritional minerals dissolve, and the silica and sand don’t. That leftover residue is your AIA.
Think of it as the sand meter on the report. Each extra point of AIA is roughly a point of your invoice that’s paying for weight and not nutrition.
A few things we’ve learnt from reading thousands of these:
- Rice products naturally run higher, because rice carries its own silica. So a DORB lot will always show more AIA than a Soya DOC lot. Compare each ingredient with its own normal, never with a different material.
- Look at total ash and AIA side by side. When both creep up and protein slips down, dilution is nearly always the reason.
- Keep a running log. AIA going from 2.5% to 4% across a few deliveries feels like nothing on any given day, but on a chart it jumps right out.
5. Crude fibre or NDF and ADF for dairy rations?
Crude fibre is whatever’s left after boiling in weak acid and then weak alkali. It’s fast and inexpensive, which is why nearly every Indian trade report still carries it.
Its blind spot is that the boiling washes away most of the hemicellulose and some lignin. That missing fibre gets counted in NFE instead, so CF ends up lower than the real fibre content, sometimes by quite a lot.
The Van Soest system gives you two more useful numbers.
| Measure | What’s in it | Where it helps |
| Crude fibre (CF) | Part of the cellulose and lignin | Quick trade check and comparing one lot with the next |
| NDF (neutral detergent fibre) | Hemicellulose, cellulose and lignin | Total cell wall and ration bulk |
| ADF (acid detergent fibre) | Cellulose and lignin | Estimating digestibility and energy |
Our honest take? If you’re formulating for dairy cattle or buffalo, work off NDF and ADF wherever possible and keep CF as your quick consistency check. In poultry and swine feed, CF still earns its place, since a sudden rise usually means husk or hull has got into the lot.
If your supplier only ever gives you CF, it’s perfectly fair to request NDF and ADF on a sample now and then, at least once a season.
6. How NFE is worked out?
Nobody actually measures NFE. The lab adds up the other five lines, subtracts the total from 100, and calls the remainder nitrogen free extract.
NFE (%) = 100 − (Moisture + CP + EE + CF + Ash)
If the report is on dry matter, drop moisture from the bracket. Just make sure every value you plug in sits on the same basis.
In theory NFE stands for the easy carbohydrates, mostly starch and sugar. In practice it also absorbs every small error from the other tests, along with all the hemicellulose crude fibre didn’t catch.
That’s why it can fool you with by-products. Maize DDGS often reports 35 to 40% NFE, even though most of the maize starch was turned into ethanol long before the DDGS existed. A large share of that “NFE” is really fibre. Use it to balance the sheet, not as a measure of starch.
7. Two sample reports, with our notes!
These are illustrative reports based on typical North Indian values, all as is. They’re meant to show how the numbers relate to each other, not to describe any real lot.
Sample 1: Maize DDGS
| Parameter | Result (%) | Typical range (%) | Our note |
| Moisture | 10.4 | 9 to 11 | Fine for storage. DM works out to 89.6%. |
| Crude protein | 28.6 | 26 to 32 | Right in the middle. About 31.9% on DM. |
| Ether extract | 9.2 | 8 to 12 | Normal for full fat DDGS. Check it against your last few lots. |
| Crude fibre | 7.4 | 6 to 9 | All good. Above 10, we’d ring the supplier. |
| Total ash | 4.8 | 4 to 6 | Normal minerals. |
| AIA | 0.9 | Up to 1 | Clean, very little sand. |
| NFE (calculated) | 39.6 | 35 to 42 | Balancing figure, and mostly fibre. |
Nothing to worry about here. Every line sits in range, and the numbers agree with one another. If you’d like to know why DDGS carries this particular mix of protein, fat and fibre, our piece on what DDGS is explains it.
Sample 2: two DORB lots, side by side
| Parameter | Lot A (%) | Lot B (%) | What moved |
| Moisture | 9.6 | 9.8 | Hardly anything |
| Crude protein | 15.4 | 13.2 | Fell 2.2 points |
| Ether extract | 1.1 | 1.0 | Both well extracted |
| Crude fibre | 13.2 | 12.1 | A little lower |
| Total ash | 11.8 | 16.4 | Rose 4.6 points |
| AIA | 3.1 | 6.8 | More than doubled |
| NFE (calculated) | 48.9 | 47.5 | Small change |
Lot A is a perfectly normal DORB lot. At 3.1%, AIA is on the upper side of comfortable, so we’d note it down and keep an eye on the next truck.
Lot B is where it gets interesting. Protein dropped, ash went up, and AIA more than doubled, all at once. When those three move together like that, it’s nearly always sand or soil, or a cheaper bran mixed in. Notice that oil and moisture look completely normal. A quick protein and moisture check at the gate would have let this one straight through.
This is probably the most common DORB quality problem in India, and our DORB nutrition guide raises the same point.
8. Red flag values for DDGS, DORB and Soya DOC
These are the ranges we usually see on good quality supply in North India, as is basis. The number in brackets is roughly where we’d hold the lot and start asking questions. Of course, whatever your signed contract says always takes priority.
| Parameter (%) | Maize DDGS | DORB | Soya DOC |
| Moisture | 9 to 11 (flag above 12) | 9 to 11 (flag above 12) | 10 to 12 (flag above 12.5) |
| Crude protein | 26 to 32 (flag below contract) | 14 to 17 (flag below 13) | 45 to 48 (flag below contract, or a sudden rise) |
| Ether extract | 8 to 12 (flag a swing of 2 or more points between lots) | 1 to 1.5 (flag above 2) | 0.5 to 1.5 (flag above 2) |
| Crude fibre | 6 to 9 (flag above 10) | 11 to 14 (flag above 15) | 5 to 7 (flag above 7) |
| Total ash | 4 to 6 (flag above 7) | 9 to 12 (flag above 14) | 6 to 7.5 (flag above 8.5) |
| AIA | Up to 1 (flag above 1.5) | Up to 3 (flag above 4) | Up to 1.5 (flag above 2) |
What usually sits behind each flag:
- Moisture too high means you’re buying water, and the stock won’t keep as well.
- Low protein alongside high ash and AIA nearly always means sand, soil or a lower grade blend.
- Protein that’s higher than normal is a reason to test for urea.
- Too much EE in DORB or a DOC suggests the oil wasn’t fully extracted.
- High fibre in DORB usually means husk has been mixed in.
One last reminder. Run a proper mycotoxin panel alongside all this, especially on anything made from maize. Proximate analysis tells you what’s inside the bag. It can’t tell you whether aflatoxin is.
How we read the same report at Brinda Foods?
We look at this exact sheet from the other side. Before any lot of Maize DDGS or De-Oiled Rice Bran leaves our Panipat facility, these six lines are the first things we check.
What we’re after is simple. When your QC team tests our material at the gate, their numbers should match ours, delivery after delivery. That’s what lets a nutritionist formulate without padding in a safety margin.
Need a sample report for any of our raw materials, or a hand matching a spec to your formulation? Drop us an enquiry. We genuinely enjoy these conversations.
Frequently asked questions
- What is proximate analysis of feed?
It’s a routine lab test that sorts a feed sample into moisture, crude protein, ether extract, crude fibre, ash and nitrogen free extract. Buyers and nutritionists use it for a quick, standard read on any raw material. - Why is crude protein nitrogen × 6.25?
Feed protein is about 16% nitrogen on average, and 100 ÷ 16 is 6.25. Labs measure the nitrogen and multiply by that number. - What’s the difference between total ash and acid insoluble ash?
Total ash is all the mineral matter left after burning, sand included. AIA is the part that won’t dissolve in acid, which is mainly sand and silica. - How do you calculate NFE?
Subtract moisture, crude protein, ether extract, crude fibre and ash from 100. Whatever remains is NFE. - Crude fibre or NDF and ADF for dairy feed?
NDF and ADF describe fibre in ruminant rations far better. Crude fibre is still handy for checking one delivery against the next. - At what AIA level should a DORB lot worry me?
Up to around 3% is usually fine. Above 4%, especially if protein has dropped too, there’s very likely sand or soil in it. - Is a dry matter report better than an as is report?
Neither one is better. What counts is comparing suppliers on the same basis, and making sure your formulation software uses that same basis too.

[…] Labs go with DM so samples can be compared. Two DORB lots at different moisture only line up properly once the water’s taken out of both. If you want each line of a proximate analysis explained, see our guide on how to read a feed lab report. […]
[…] the results land, our explainer on how to read a feed lab report walks through every line. And if you’re comparing two lots with different moisture, read up on […]
[…] get free gossypol tested separately along with the usual protein, fibre and AIA. Our guide on reading a feed lab report tells you how to make sense of those […]
[…] silica from the rice hulls. I’d ask for AIA (acid insoluble ash) on every single lot. Our note on reading a feed lab report explains which numbers deserve your attention […]
[…] a line-by-line walk through a real report format, read how to read a feed lab report. For judging the supplier’s own certificate, our COA guide lists what a believable one […]